Use a Data Driven Sales Approach
Is your sales process working for you? How would you know if it wasn't?
Having the ability to view every detail of your overall sales process can be hugely beneficial. With Insights and In-App Reports, Daylite gives you the information you need to understand your strengths, and where you may want to focus to improve your sales process.
Refine Your Sales Process With Insight View
Insight View offers a real time visualization for each of your Opportunities. Use it to see how many Opportunities you've Won, how many you've Lost, and how much money each of those Opportunities represent.
Insight View will also show you your top Opportunities, where they may be getting bogged down, who your Top Performers are, and even a historical view of when new Opportunities came in and when they closed.
An Overview of Insight View
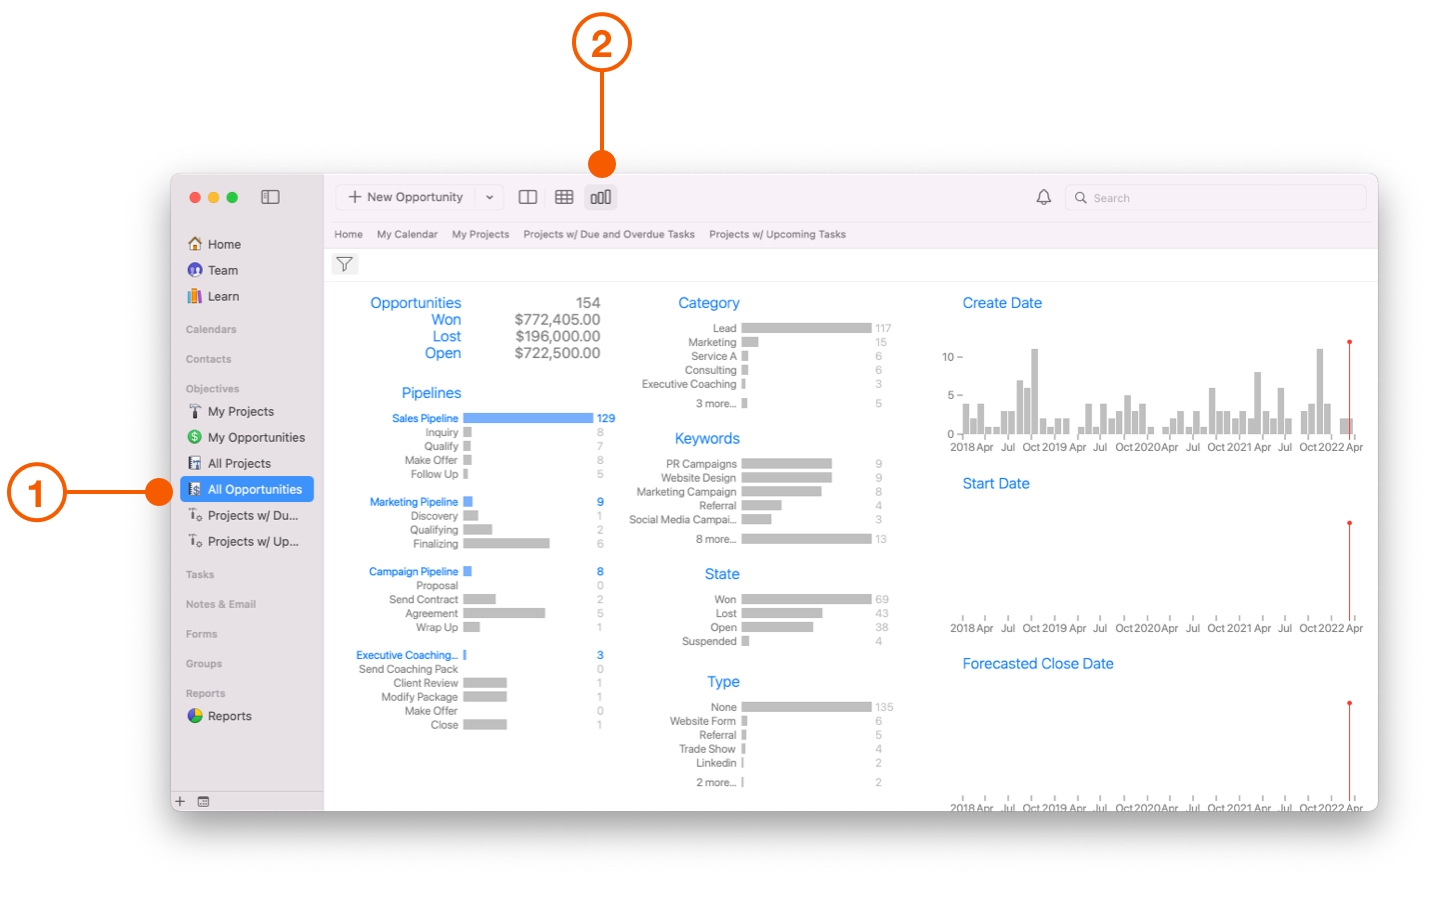
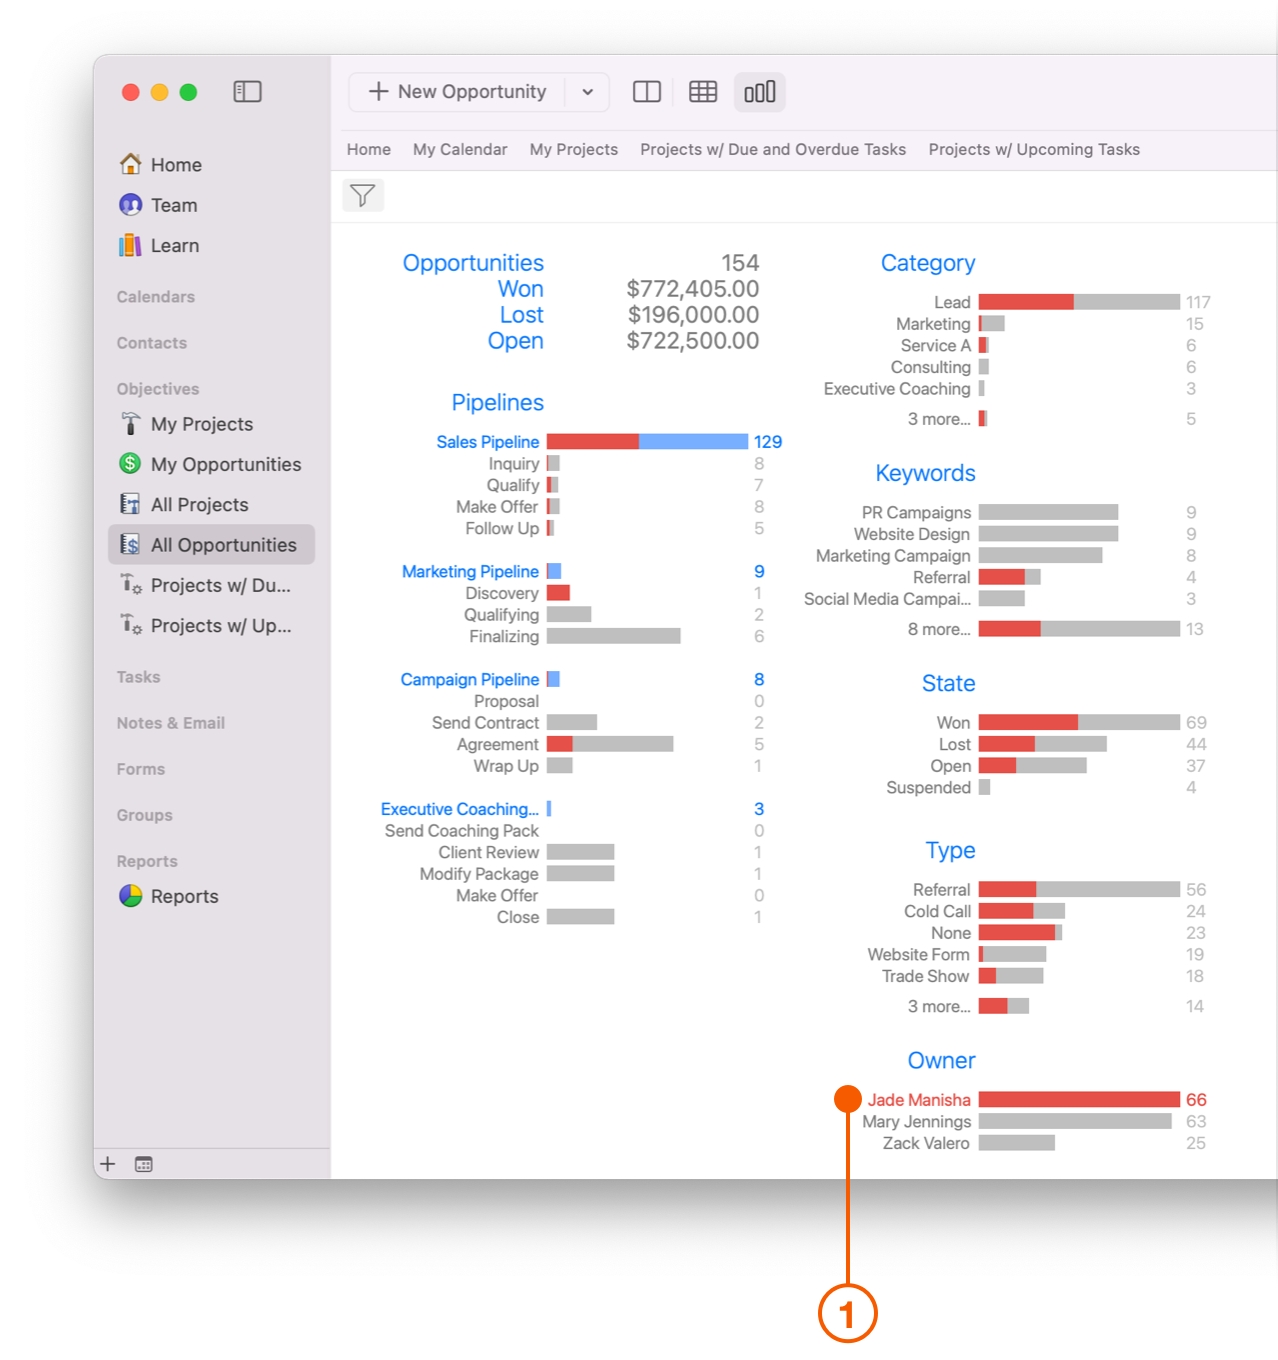
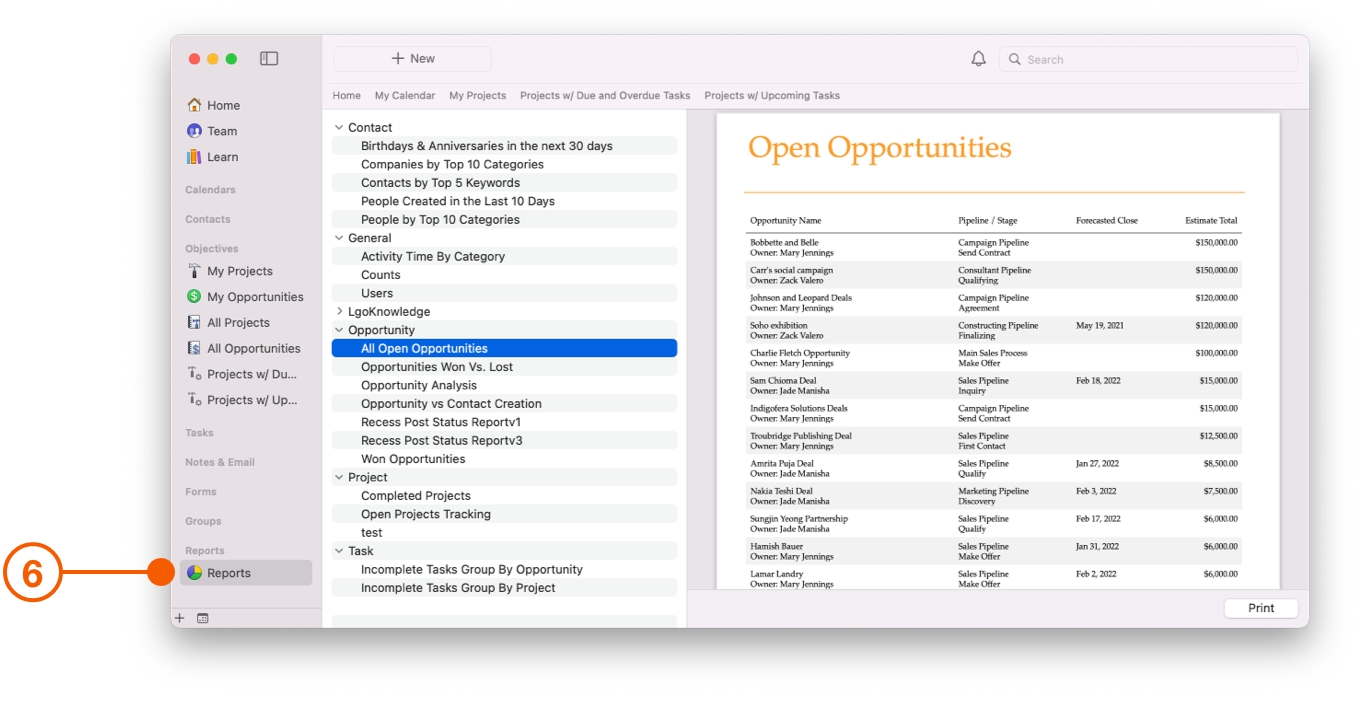
Select All Opportunities from the Daylite Sidebar.
Choose Insight View from the Daylite Toolbar.
You will notice that fields turn red when you hover your pointer over them, including all corresponding fields related to your inquiry. Daylite does this so you can find the information you need quickly, as the highlighted red fields relate to each other. Double clicking on any red highlighted field will filter your search, in essence, drilling down one level further.
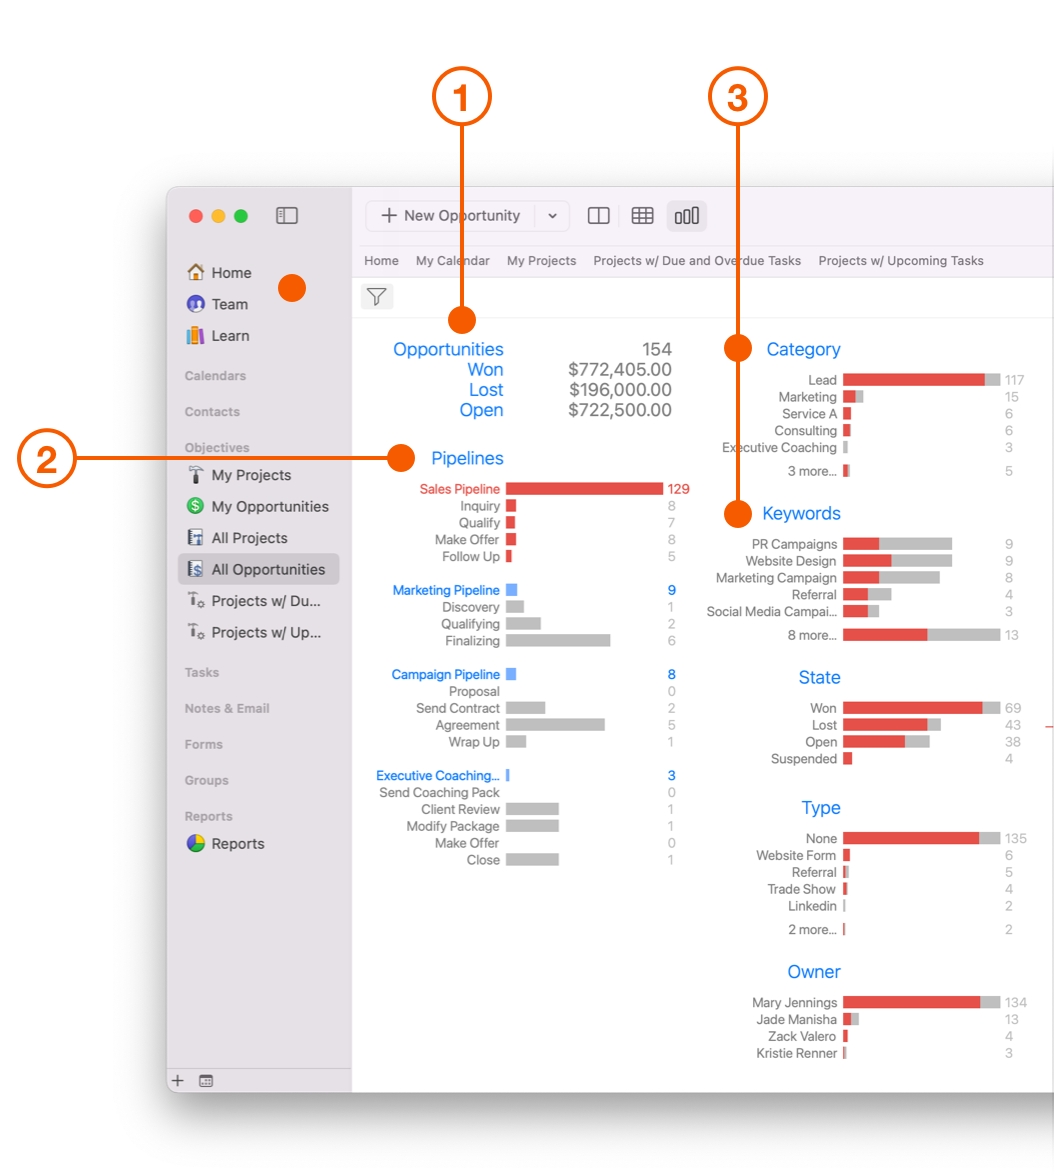
Opportunities- View Opportunities represented by Won, Lost, and Open Sales. This is a very high level view of what deals you currently have on the go.
Pipelines- All your Pipelines are represented here. This also includes each Stage assigned to a Pipeline.
Category and Keywords- Category and Keywords assigned to Opportunities are shown here. This is useful to see quickly which Categories or Keywords are generating sales opportunities.
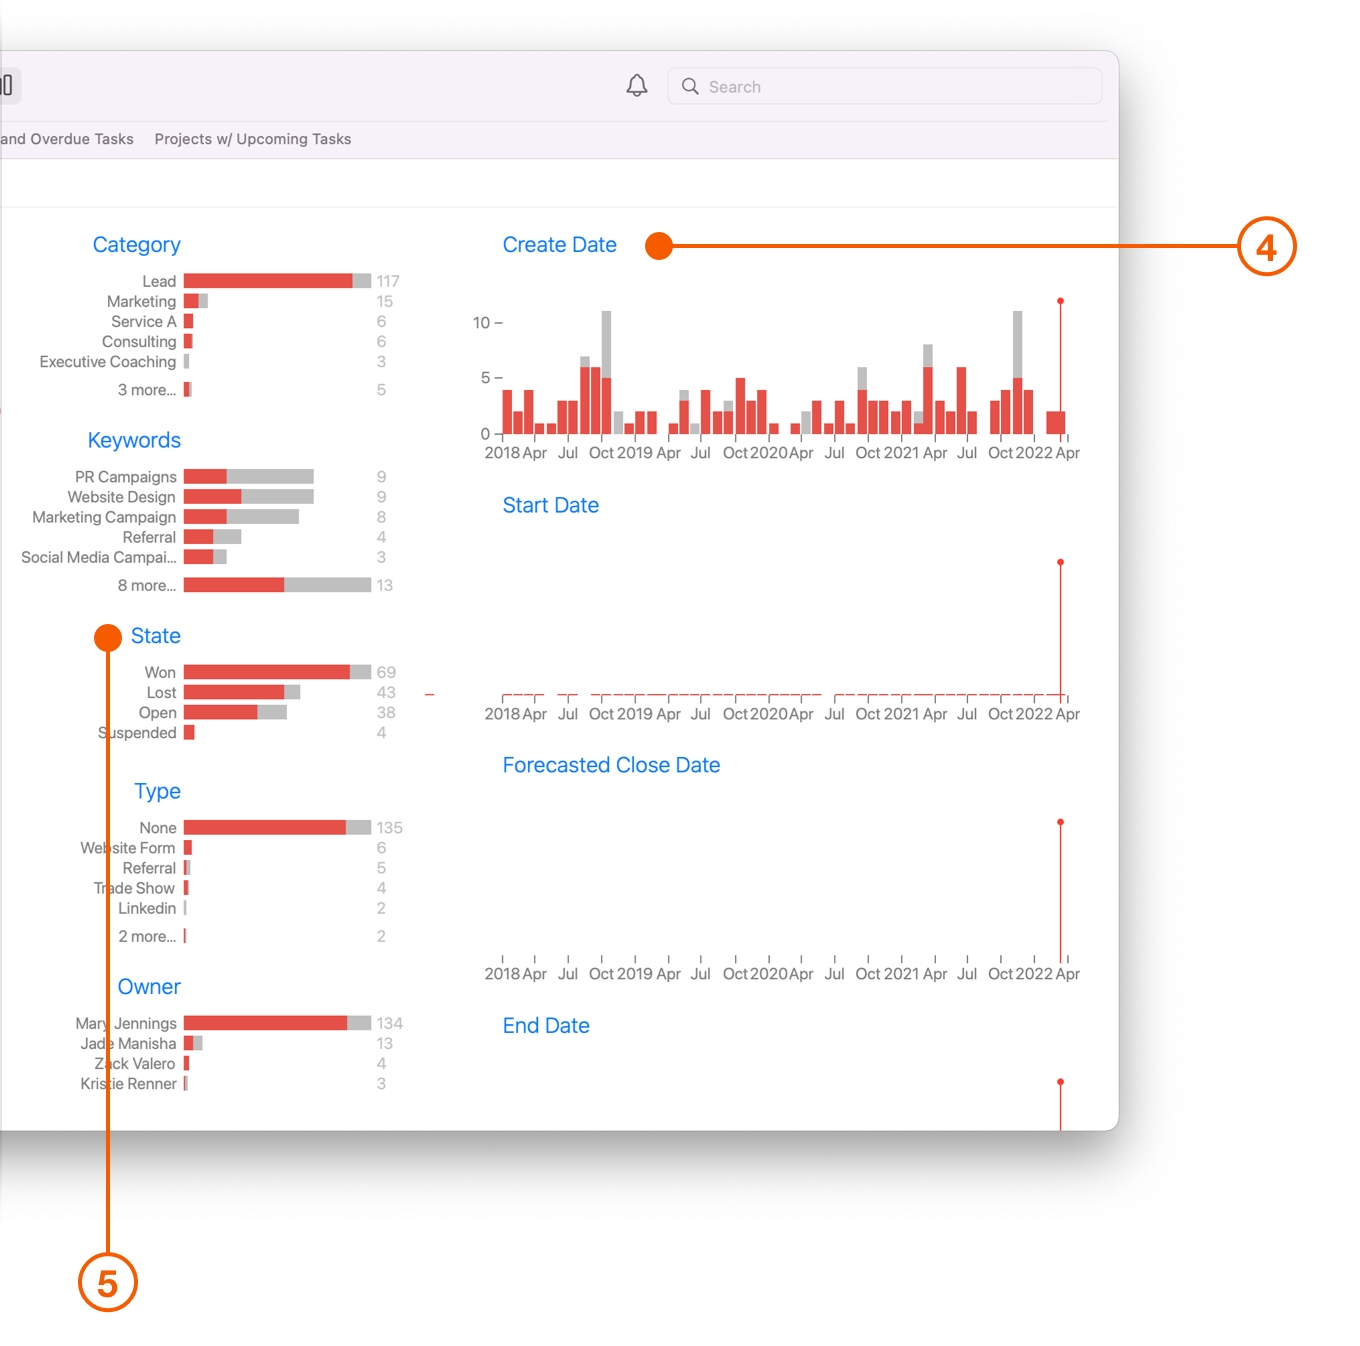
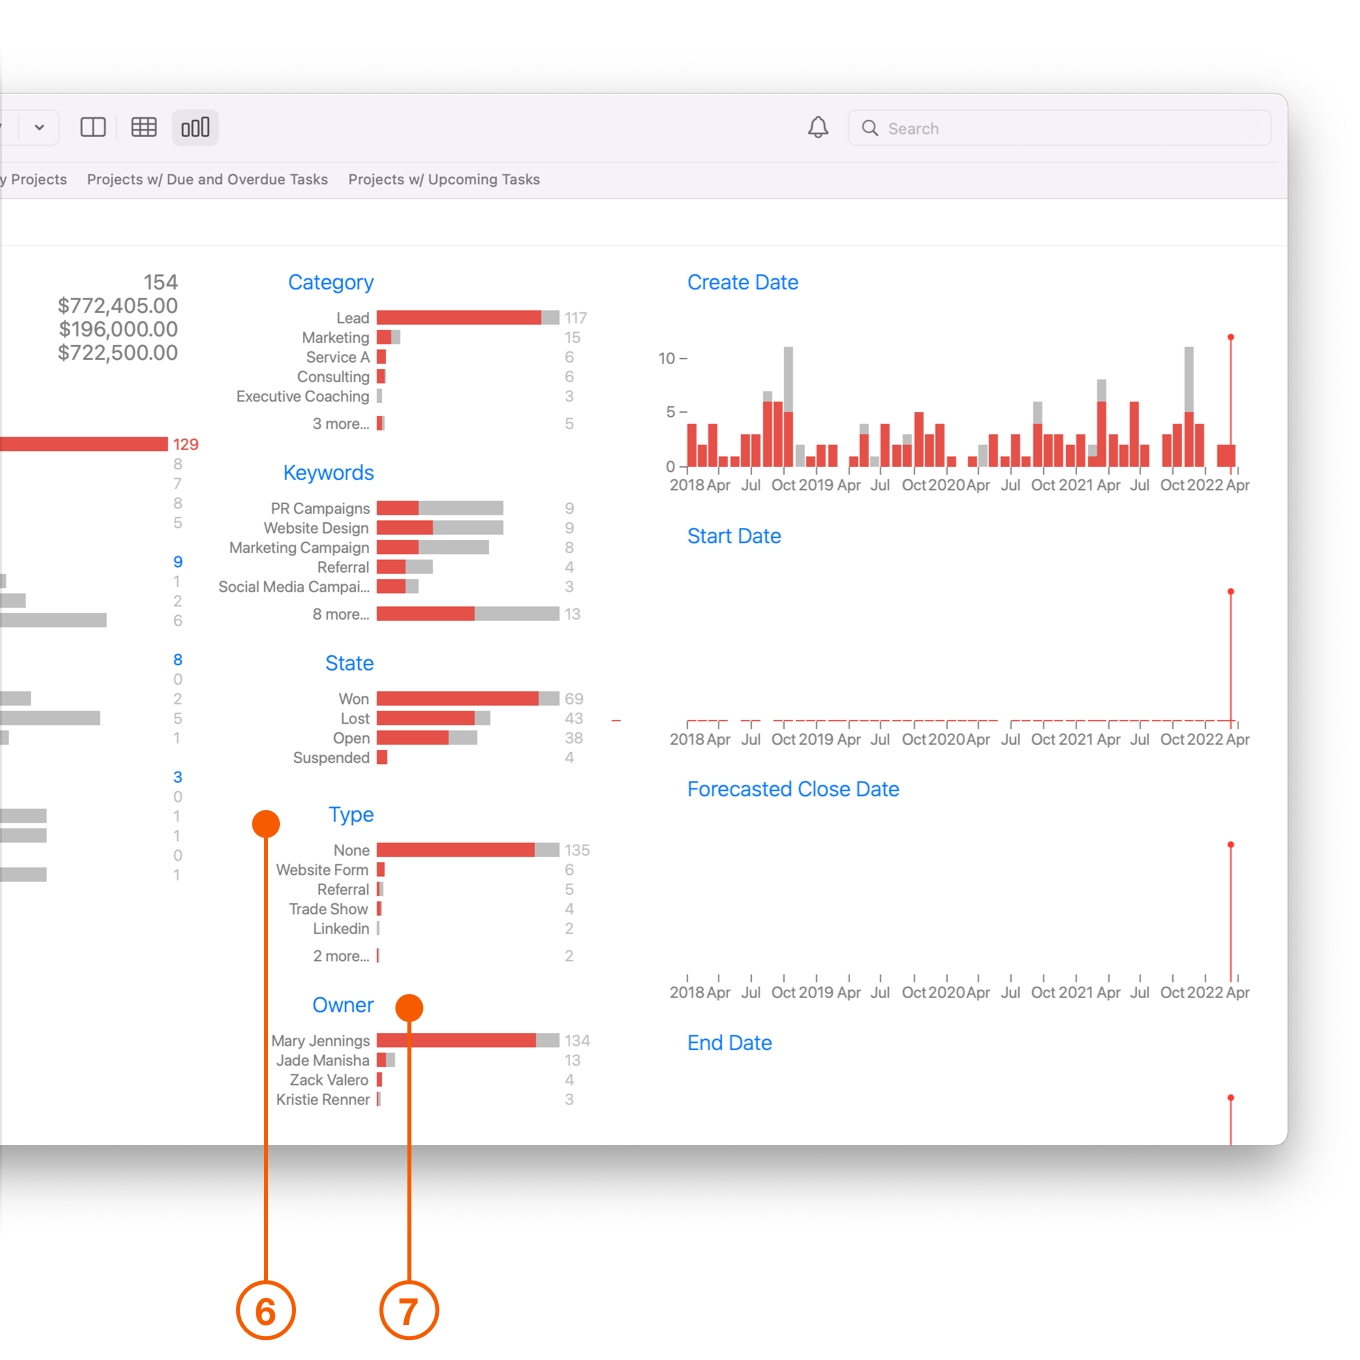
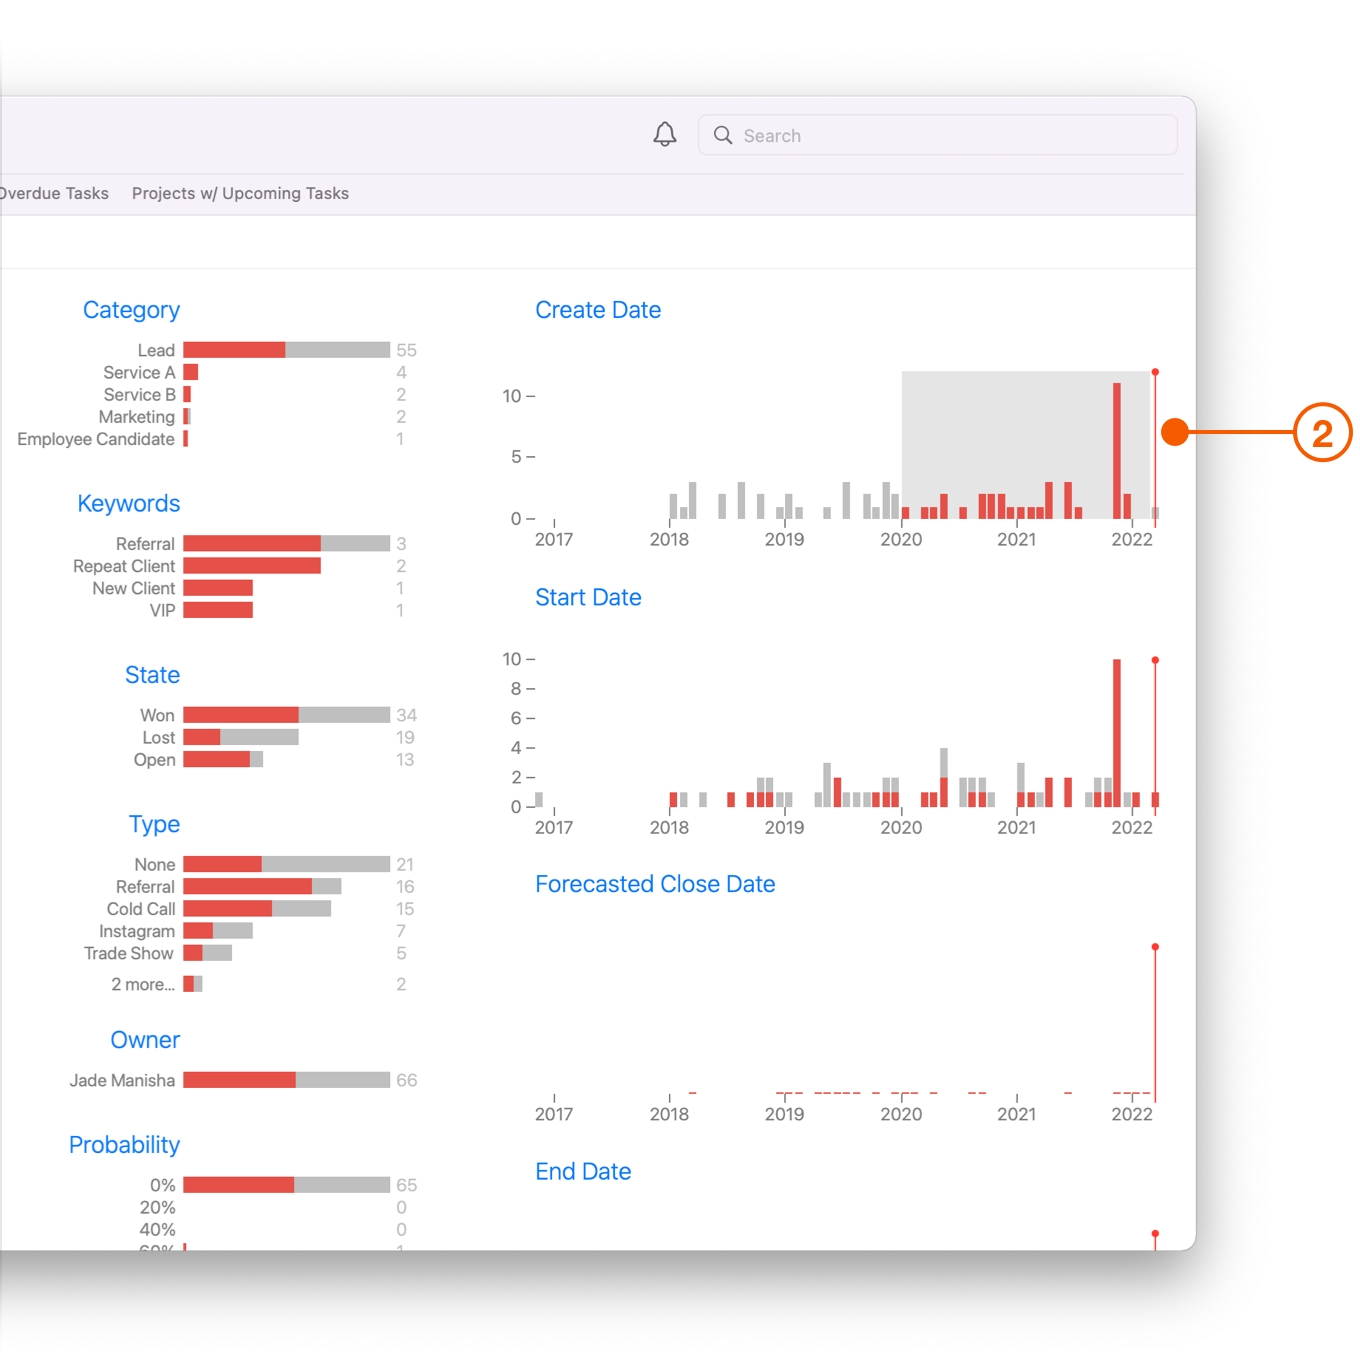
Dates- These are broken down by Create, Start, Forecasted, End and Modify Dates. You can use the Date slider to help drill down to specific dates or times.
State- Find out how many Opportunities were Won, Lost, Open, or Suspended. These are represented by the number of Opportunities, as opposed to the sales amount.
Type- This field represents where the Opportunity originated from. This is a great way to discover quickly where your marketing dollars are doing them most good.
Owner- This field represents who owns the account. It lets you see at a glance who your best Sales person may be, but also who may need guidance or assistance.
Creating and Printing Custom Reports Using Multi-Column List
Insight View is a fantastic way to find Sales information you need quickly and easily, however when it comes to printing out reports, nothing beats Daylite's Multi-Column List for customization.
As an example...
Select the Account Salesperson from the Owner list.
Select a Date range.
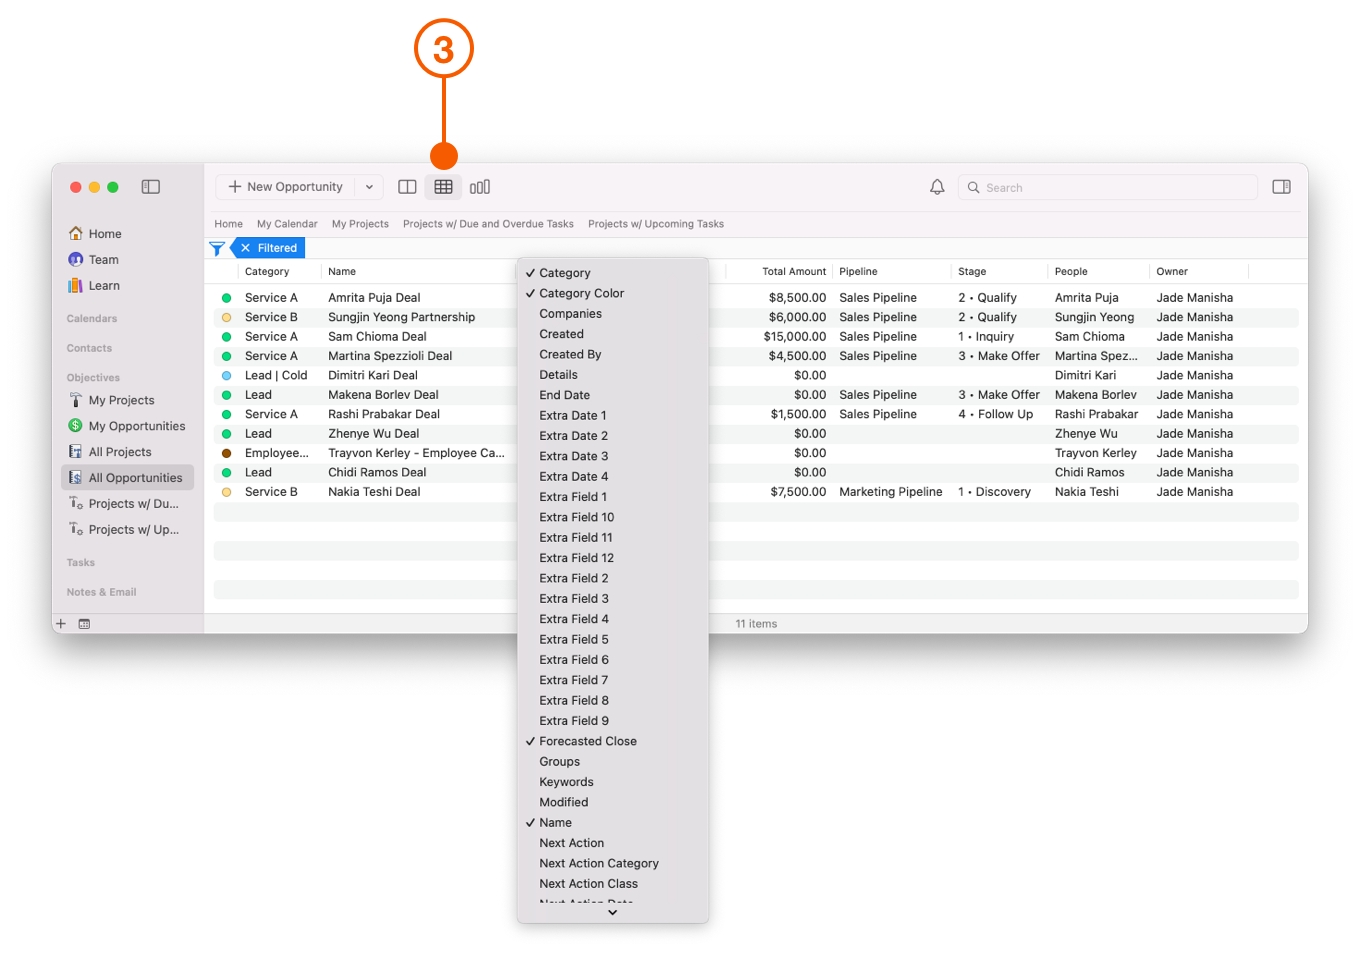
Select Multi-Column List from the Daylite Taskbar. Drag each column into the order you want. Right click the column to add or remove.
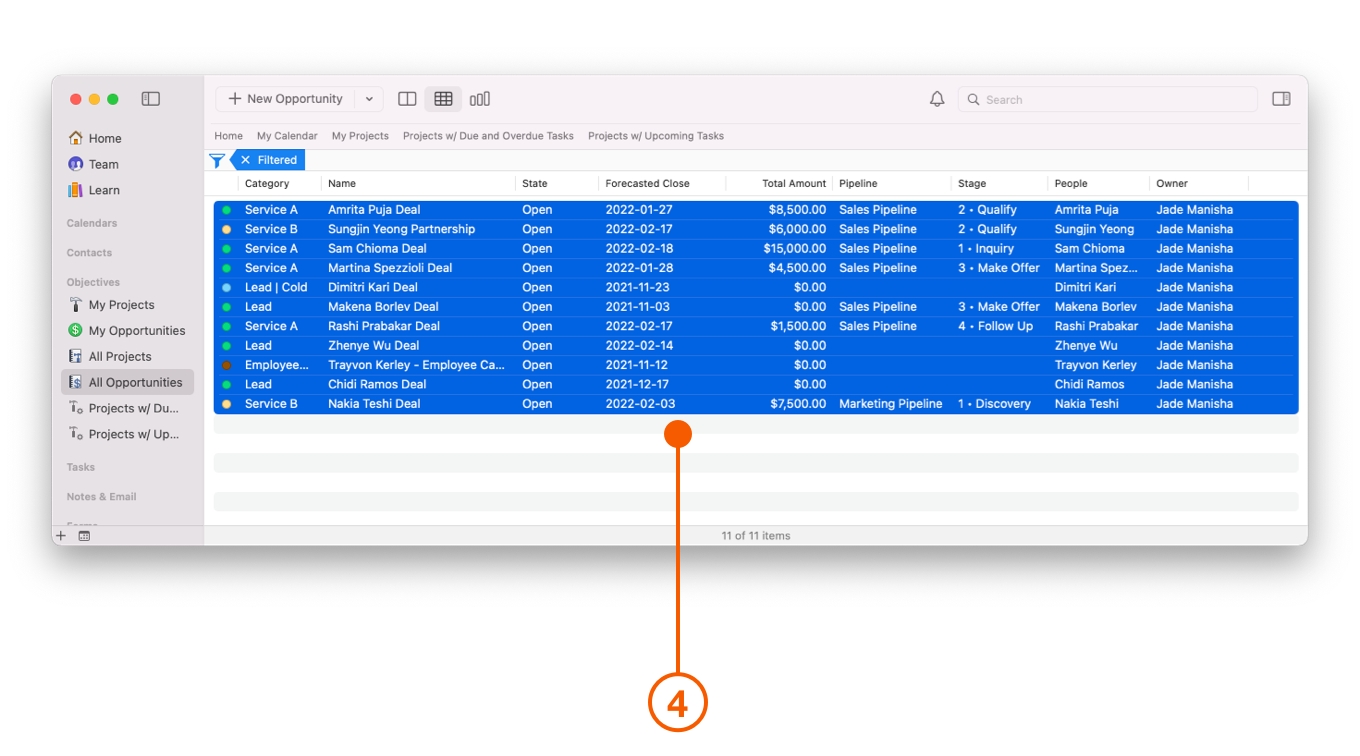
Highlight the Opportunities you want to include in the printed report.
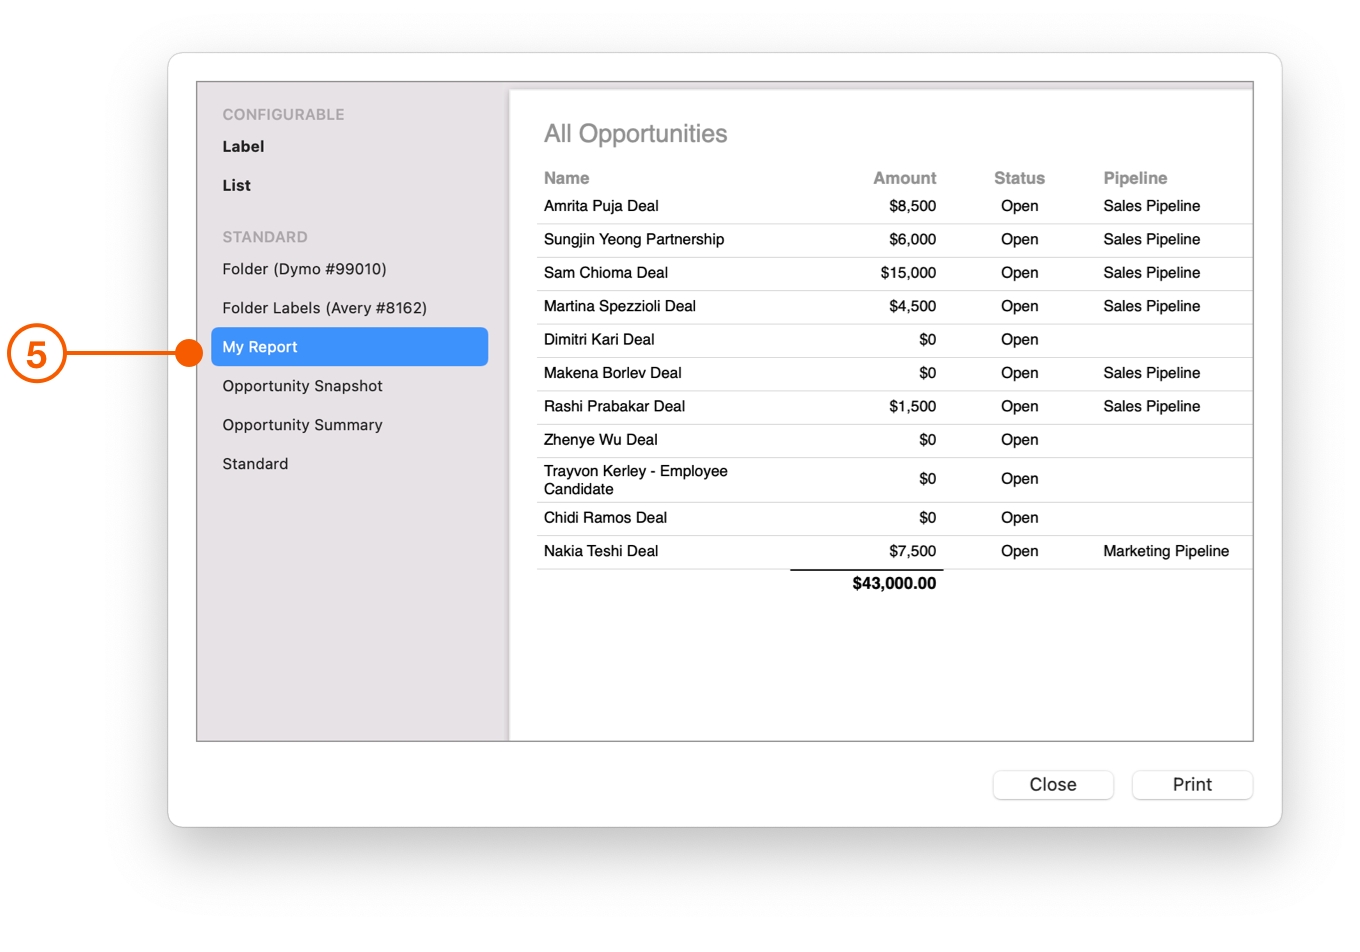
Navigate to Daylite > File > Print and select which style of Report you want printed.
Daylite's Reports** can be also be used for PDF Reports, Sales Meetings, and Summaries.
Create your own Custom Reports or contact us and we can pair you with a Daylite Expert who can customize a Report based on your needs.
Wrap Up
Your deals are a treasure trove of data that you can use to refine your process and close more deals. Use Insight View and Daylite Reports to improve your effectiveness, streamline your processes, and close more deals.
Interested in learning more about using Reports to track your Close Rate? Check out the article Tracking Your Close Rate on Deals.
Last updated