As a small business owner, it’s important to be able to analyze your business in order to spot trends. Analyzing your business helps you see what’s happening in your business over time so you can plan for future changes or build on what has proven to be successful. Most business owners would say that they have a fair understanding of what goes on in their business and Insight can help to prove or disprove your intuition. Sometimes our own perceptions about our business can be skewed by our involvement. We may have a clouded view of what’s really going on in our business because we don’t see the outside picture. There are questions that we have a good understanding of, but not a true, solid answer for. What opportunities have brought in the most money in the last year? How many opportunities has each employee won and lost? What is the main reason for any lost opportunities? How many leads do we have versus confirmed customers?
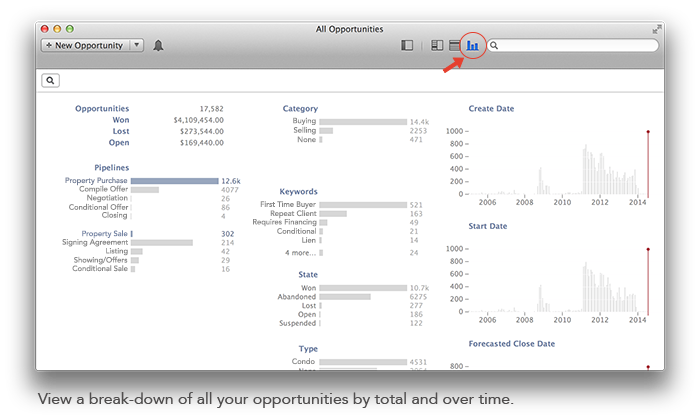
Insight is one of the new features in Daylite 5 that can help answer these questions about your business without having to run complex reports. The insight view is an additional way to view your data stored in Daylite. From any list of contacts, projects, or opportunities, you can click the Insight icon in the top right corner of your Daylite window and view this information in the form of interactive graphs. These graphs allow you to easily comprehend your information and spot trends.
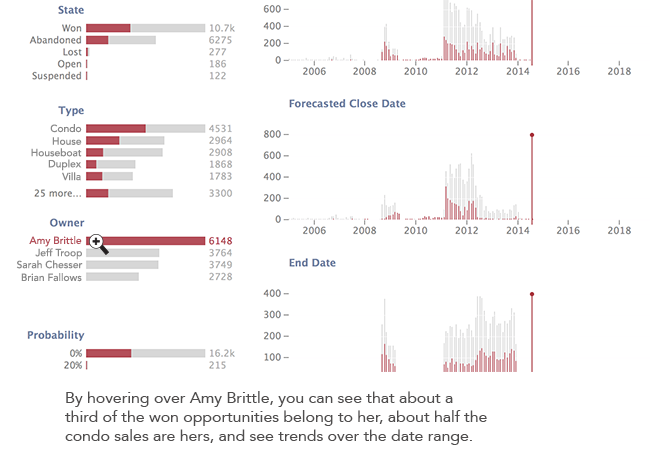
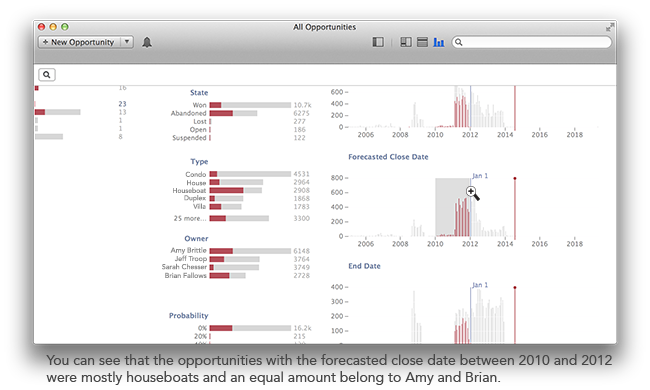
You can select all opportunities and hover over a specific employee under “Owner” and instantly all the related information to that employee is highlighted in red. You can spot the category and type of opportunity that they are in charge of, and right away see how many are won or lost. Rather than seeing this information in the form of spreadsheets, it’s easy to digest because you can see visual correlations between dates, state, type, etc. All the information you want to know about this employee’s opportunities is easy to understand because you can visually understand and pull conclusions.
You can dig deeper by selecting a date range that filters your results. You can also filter by clicking a particular state, type, etc. for example an employee’s name to see just the information that correlates with that employee. You can then save this filter as a Smart List. This way, as you filter through information, you can save these results and refer back to them later. Smart Lists in Insight work the same as regular Smart Lists so they are automatically updated and can be shared with your team. For example, you may want to view all opportunities with an upcoming forecasted closure date in the next three months and share the results with your sales team to help them prepare.
Another great benefit of the Insight view is your ability to see any information that you may not be leveraging. For example, after exploring your projects you may notice that there is no information for “estimated time”. This shows that you are not recording the estimated time for each project in Daylite. After viewing this, you may want to consider enforcing that your team starts entering this information for future projects. This way you can plan future projects around dates that you already know will be busy due to other projected deadlines. The more information you capture in Daylite, the easier it is to analyze your business. Use your information and Insight view to see what is working well and where there is room for improvement so you can make changes for future growth.
Watch this video to see the insight view in action and learn how you can use Insight to discover trends in your business.
